Mary Madison, RN, RAC-CT, CDP
Clinical Consultant – Briggs Healthcare
CMS has posted the COVID-19 nursing home data for the week ending February 5, 2023.
Comparing the February 5, 2023 data to the January 29, 2023 data shows these changes:
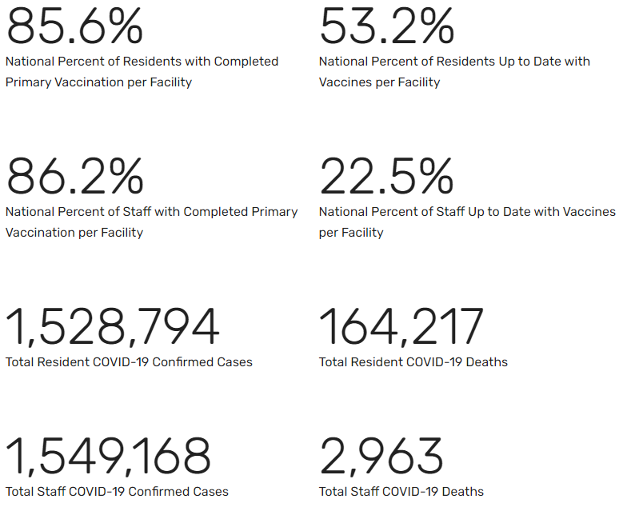
- Resident primary vaccination completion rate decreased 0.1% this week;
- Residents up to date with vaccines increased 0.5% again this past week;
- Staff primary vaccination completion rate decreased 0.1% this week after no change during the previous 5 weeks;
- Staff up to date with vaccines remained unchanged this past week;
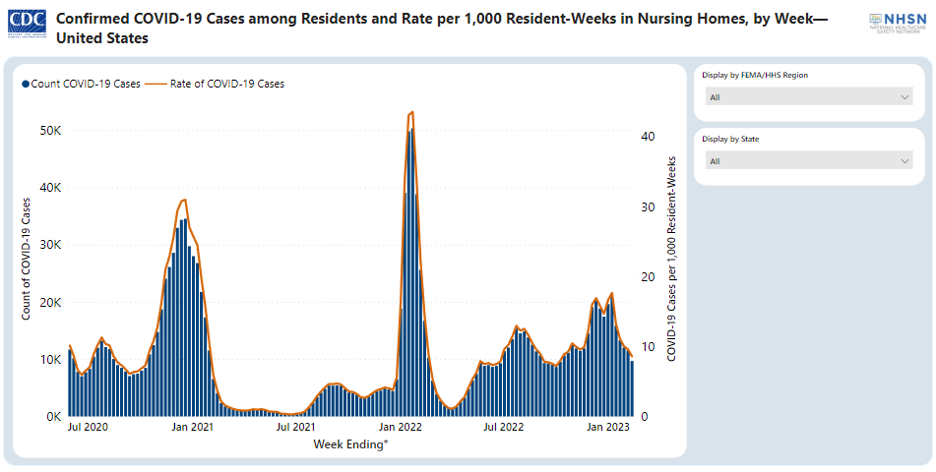
- An additional 10,846 resident cases were confirmed this past week;
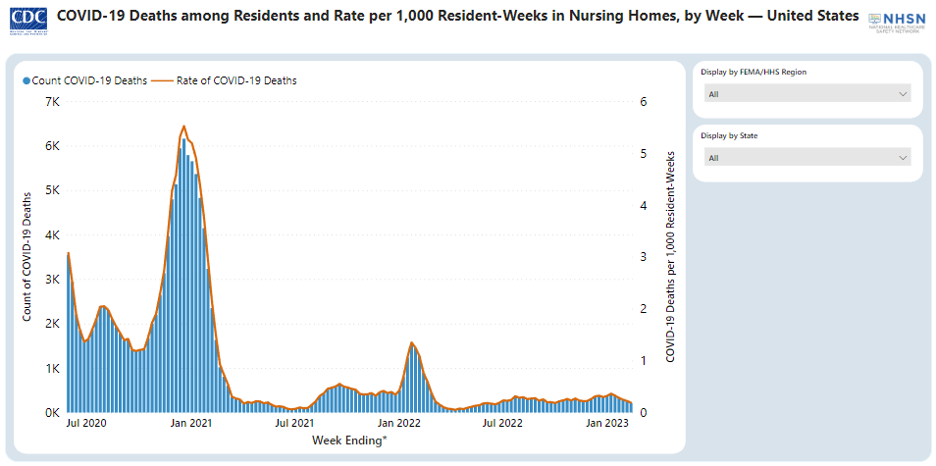
- An additional 308 resident deaths were reported this past week;
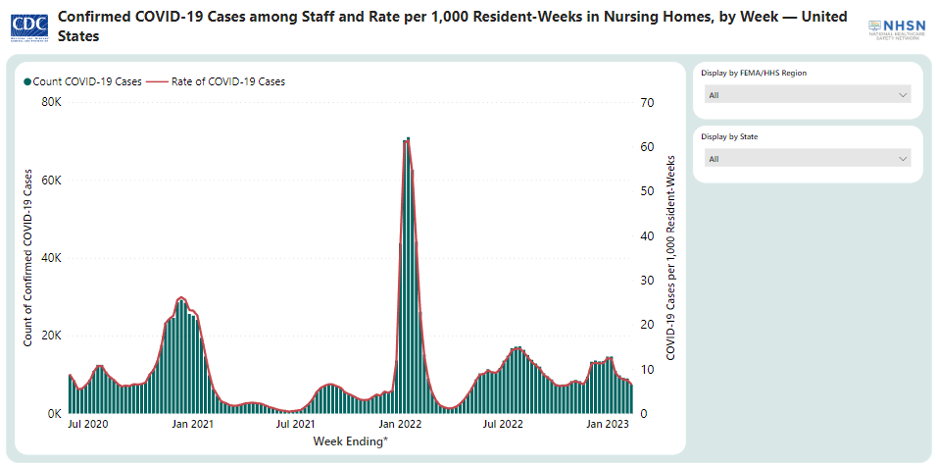
- An additional 9,403 staff cases were confirmed during this past week and
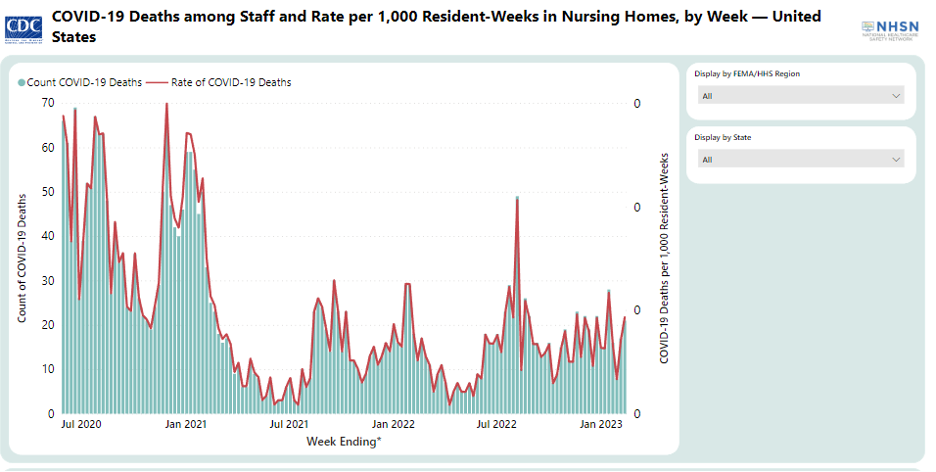
- An additional 5 staff deaths were reported during this past week.
Be sure to review your facility’s vaccination rates on the list of every nursing home with recent resident and staff vaccination rates and other pertinent data as this data will be used for completing the COVID-19 Matrix during survey. State surveyors look at this data in preparation for your survey. You’ll also need to know your current rate (as reported to NHSN) and provide it to the survey team entering your facility. This data is current as of the week ending February 5, 2023.
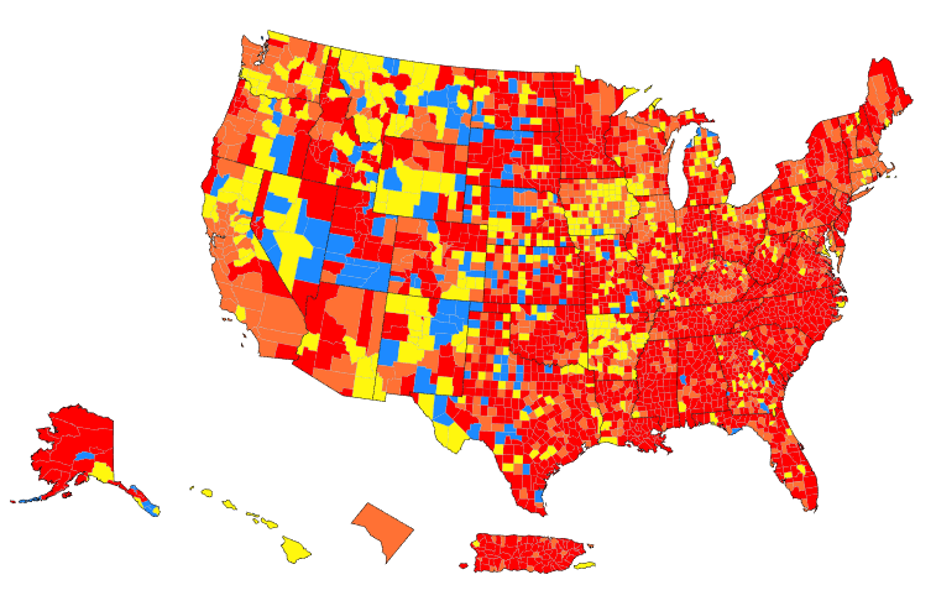
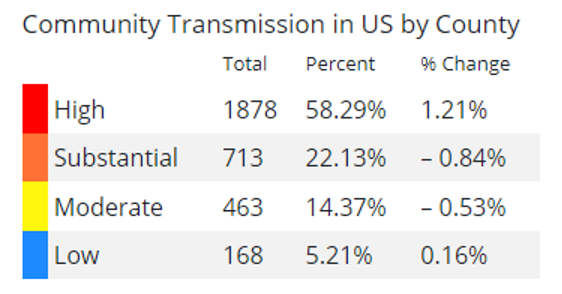
The CDC COVID Data Tracker shows these current community transmission levels as of February 15, 2023:

The NHSN Nursing Home COVID-19 Data Dashboard provides this data as of February 13, 2023 at 5:30am ET:
COVID-19 Activity (Overall)
- COVID-19 activity remains high across the country. As of February 8, 2023, there have been a total of 102,736,819 COVID-19 cases and 1,110,364 deaths from COVID-19 reported in the United States.
- The current 7-day average of weekly new cases (40,404) decreased 1.0% compared with the previous 7-day average (40,815).
- The current 7-day daily average of hospitalizations for February 1-7, 2023 was 3,665. This is a 6.2% decrease from the prior 7-day average (3.907).
- The current 7-day average of weekly new deaths (453) decreased 9.7% compared with the previous 7-day average (502).
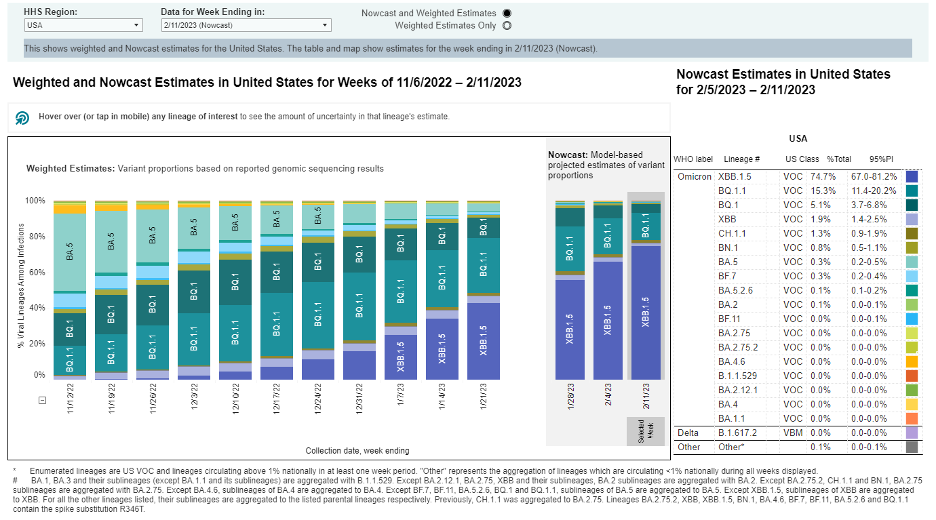
- The most prevalent Omicron lineage this week is XBB.1.5, projected to be at approximately 74.7% (95% PI 67.0-81.2%). The second most prevalent lineage is BQ.1.1, projected to be at approximately 15.3% (95% PI 11.4-20.2%).
- About 670.3 million vaccine doses have been administered in the United States.
- About 229.8 million people have completed a primary series, and nearly 52.9 million people have received an updated booster dose.
- CDC recommends getting the new updated booster if you have not done so. The booster offers added protection against circulating variants.
Data reported on February 10, 2023, from CDC’s COVID Data Tracker Weekly Review.
The CDC Summary of Variant Surveillance website summarizes three different systems being used, including the 1) National SARS-CoV-2 Genomic Surveillance System, the 2) National Wastewater Surveillance System, and the 3) Traveler-based SARS-CoV-2 Genomic Surveillance Program.