Mary Madison, RN, RAC-CT, CDP
Clinical Consultant – Briggs Healthcare
CMS has posted the nursing home COVID-19 data for the week ending January 29, 2023. (Please also view the NOTE at the end of this blog.)
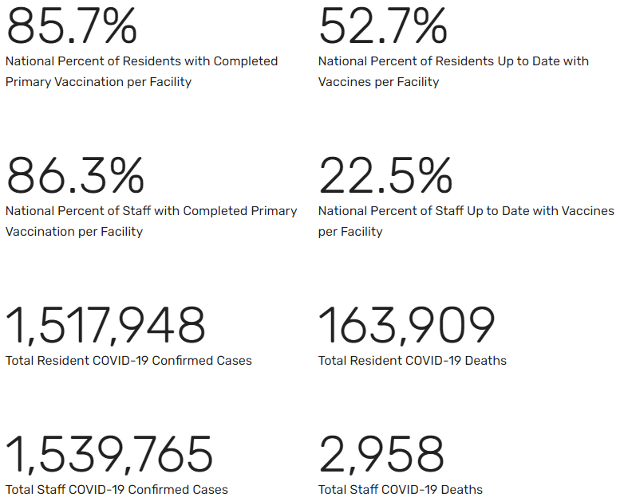
Comparing the January 29, 2023 data to the January 22, 2023 data shows these changes:
- Resident primary vaccination completion rate increased 0.1% this week;
- Residents up to date with vaccines increased 0.5% again this past week;
- Staff primary vaccination completion rate decreased 0.1% this week after no change during the past 5 weeks;
- Staff up to date with vaccines decreased 0.1% again this past week;
- An additional 12,822 resident cases were confirmed this past week;
- An additional 551 resident deaths were reported this past week;
- An additional 9,877 staff cases were confirmed during this past week and
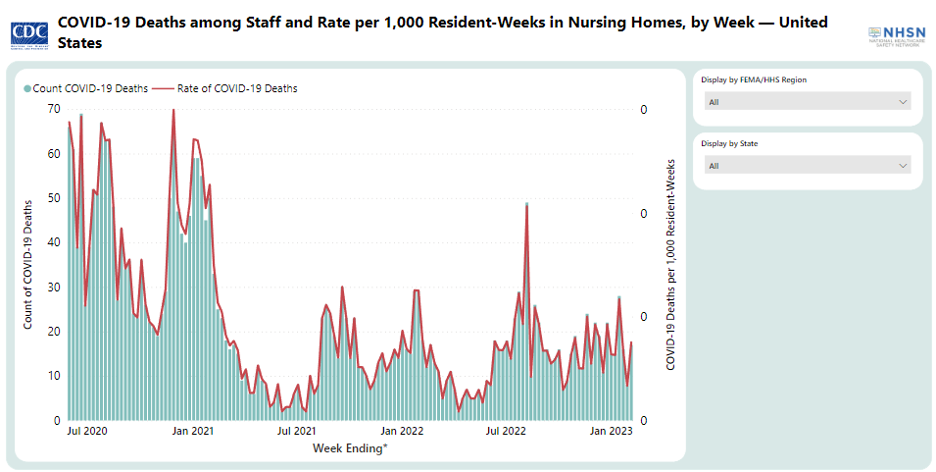
- An additional 1 staff death was reported during this past week.
Be sure to review your facility’s vaccination rates on the list of every nursing home with recent resident and staff vaccination rates and other pertinent data as this data will be used for completing the COVID-19 Matrix during survey. State surveyors look at this data in preparation for your survey. You’ll also need to know your current rate (as reported to NHSN) and provide it to the survey team entering your facility. This data is current as of the week ending January 29, 2023.
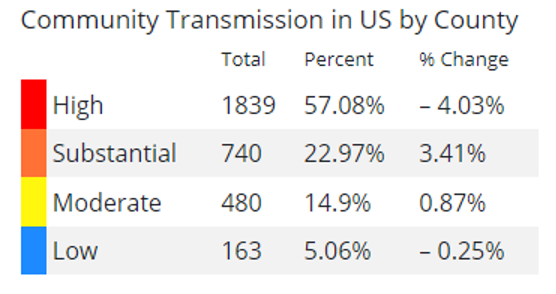
The CDC COVID Data Tracker shows these current community transmission levels as of January 31, 2023:


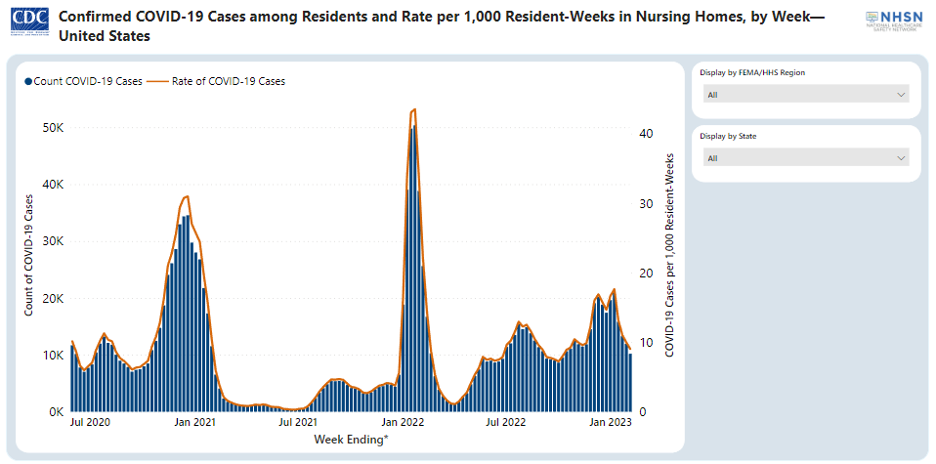
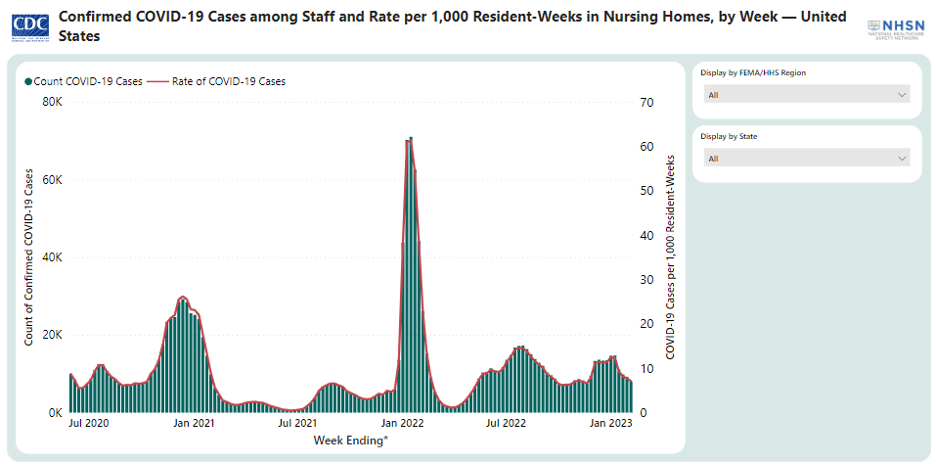
The NHSN Nursing Home COVID-19 Data Dashboard provides this data as of February 6, 2023 at 5:30am ET:

COVID-19
- COVID-19 activity remains high across the country. As of February 1, 2023, there have been a total of 102,447,438 COVID-19 cases and 1,106,824 deaths from COVID-19 reported in the United States.
- The current 7-day average of weekly new cases (40,130) decreased 6.7% compared with the previous 7-day average (43,035).
- The current 7-day daily average of hospitalizations for January 25-31, 2023 was 3,919. This is a 8.4% decrease from the prior 7-day average (4,279).
- The current 7-day average of weekly new deaths (493) decreased 9.0% compared with the previous 7-day average (542).
- The most prevalent Omicron lineage this week is XBB.1.5, projected to be at approximately 66.4% (95% PI 59.8-72.5%). The second most prevalent lineage is BQ.1.1, projected to be at approximately 19.9% (95% PI 16.2-24.1%).
- About 669.6 million vaccine doses have been administered in the United States.
- About 229.7 million people have completed a primary series, and nearly 52.4 million people have received an updated booster dose.
- CDC recommends getting the new updated booster if you have not done so. The booster offers added protection against circulating variants.
Data reported on February 3, 2023, from CDC’s COVID Data Tracker Weekly Review
The CDC Summary of Variant Surveillance website summarizes three different systems being used, including the 1) National SARS-CoV-2 Genomic Surveillance System, the 2) National Wastewater Surveillance System, and the 3) Traveler-based SARS-CoV-2 Genomic Surveillance Program.

[NOTE: In case you missed it, I encourage you to share and review yesterday’s blog regarding LTCFs: CMS Flexibilities to Fight COVID-19. CMS posted several documents for PAC providers to prepare for the end of the PHE. There will be more information coming but this 18-page document is a must-read!]
