Mary Madison, RN, RAC-CT, CDP
Clinical Consultant – Briggs Healthcare
CMS has posted nursing home COVID-19 data for the week ending April 24, 2022.

Comparing the April 24th data to the previous April 17th data shows these changes:
- Resident vaccination rate increased by 0.1% (had remained stagnant for the previous 5 weeks)
- Residents with booster doses increased by 0.6% this past week
- Staff vaccination rate increased 0.1% from previous week
- Staff with booster doses increased by 0.6% this past week
- An additional 2,761 resident cases were confirmed/reported this week (increased)
- 47 additional resident deaths were confirmed/reported this week (vaccines are working!)
- An additional 3,504 staff cases were confirmed/reported this week (increased)
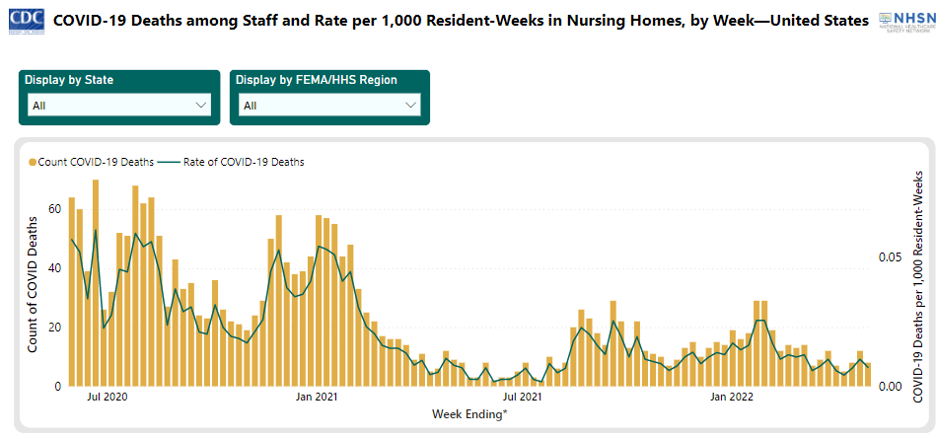
- An additional 11 staff deaths were confirmed/reported this week (double previous week’s staff deaths)
Keep up your efforts to educate staff, residents and families about the life-saving benefits of vaccination as well as the importance of getting the booster. Lives depend on both.
Cases are rising again due to the omicron variant BA.2 and there’s also another subvariant detected as of late April/early May – BA.2.12.1. Additionally, there are more variants out there and on the rise – BA.4 and BA.5. The SARS-CoV-2 virus is not done with us yet.
Be sure to review your facility’s vaccination rates on the list of every nursing home with recent resident and staff vaccination rates and other pertinent data as this data will be used for completing the COVID-19 Matrix during survey. State surveyors look at this data in preparation for your survey. You’ll also need to know your current rate (as reported to NHSN) and provide it to the survey team entering your facility. This data is current as of the week ending April 24, 2022.
The CDC COVID Data Tracker shows these current community transmission levels:


The above 2 graphics show that Community transmission is rising again with a 7.32% change in counties showing a high transmission (the previous week’s high percentage of change was 6.16%, the week before that was 5%). Definitely more counties in the red. This is also borne out by the United States At a Glance – cases and hospitalizations are on the increase. Deaths a bit of a bump up but far less than earlier days during this ongoing pandemic, thanks to the vaccines and boosters.
You’ll also note these changes in the NHSN dashboards below. Pictures are worth a thousand words.
The NHSN Nursing Home Covid-19 Data Dashboard provides this data as of May 2, 2022, at 5:30am ET: